Deep-Resolution Plant Phenotyping Platform
Introduction
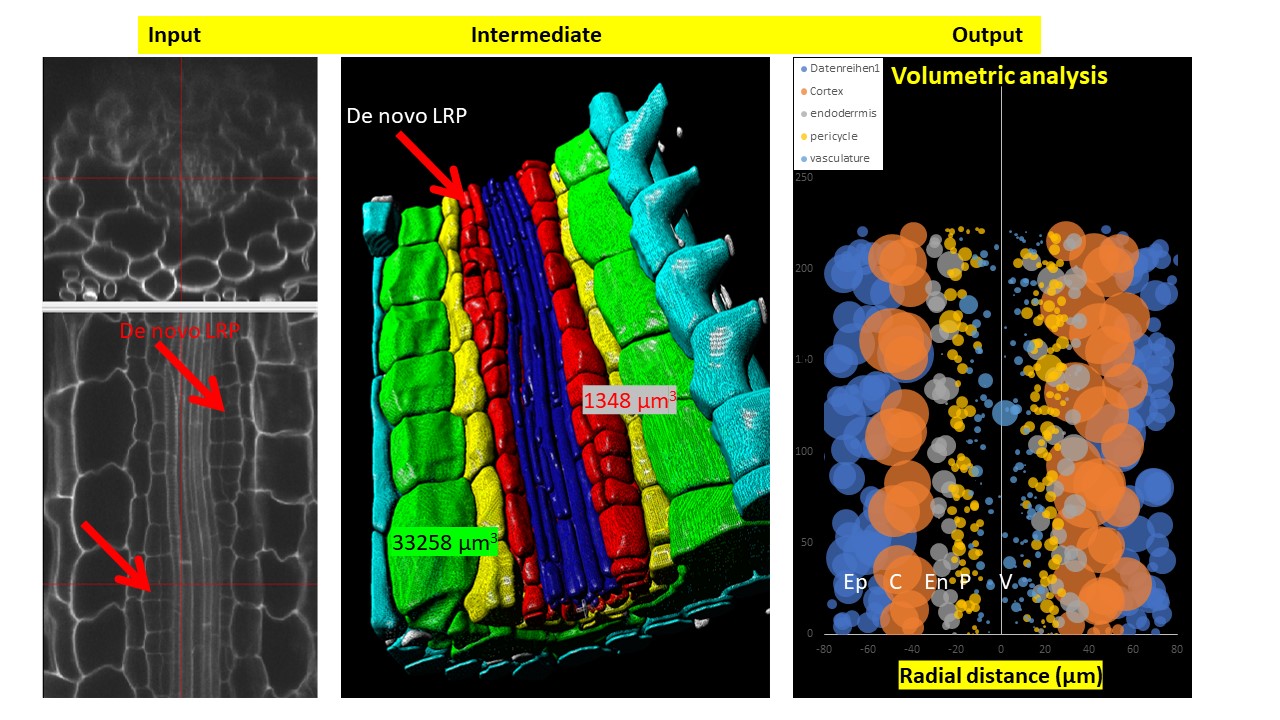
DRPPP (Deep-Resolution Plant Phenotyping Platform) is a combination of protocols for plant tissue preparation, labeling, scanning, and open-source software to visualize and analyze 4D biological datasets. Developed by collaboration between plant and computer scientists, it analyzes and quantifies 3D confocal data from numerous plant organs. The software includes an internal coordinate system that allows researchers to recognize cell layers and cell position in specific organs. The platform allows researchers to detect cell borders to quantified cell geometry and organelles like nuclei to perform quantitative in situ analysis of the cell cycle and chromatin status. The platform does not require endogenous markers; hence it can be applied for diverse plant species.
The fundamental research interests addressed by HRPPP are:
- Volumetric organ and cell shape extraction
- Quantifications of chromatin modification
- Fluorescence signal quantification
- Quantitative analysis of the protein and protein complexes localization
- Extracting volumetric cell geometry for modeling
- Analysis of cell cycle kinetics
Tutorial
Tutorial consist from three different chapters: sample preparation (labelling), scaning, and image processing.
Labelling protocol
Live and fixed tissue samples
The analysis of whole organs at sub-cellular resolution requires recording multiple tiles (typically 3-5), with depth-dependent dynamic adaption of recording parameters. Thus, living objects (especially root), were hard to label and produce high quality images because or rapid growth and movement. So, although the pipeline does not preclude live imaging, high quality analyses can only be performed on fixed tissue.
Cell boundaries detection
In plants, we can detect cell boundaries based on labelling of cell wall or plasma membrane. One of the necessary conditions for successful boundary detection by software is the equal intensity of the boundary of each cell. For this reason, a simple cellulose labeling is not suitable for boundary detection because of the variation of cell wall thickness and other variations in cell wall properties within an organ. We performed optimization of the cell wall labeling by partial digestion of the cell wall, allowing us to make almost equal signal intensity for all cell layers after calcofluor white labeling. This labeling can be combined with nuclei detection, gene expression analysis by immunolocalization or PLA assay. However, this option is more suitable for the leaves because of their equal cell wall thickness to compare with the roots. The second option is to use polysaccharide labelling after normalization of ketone bound digestion (so-called pseudo-Schiff reagent labeling) (Pearse, 1968). However, this procedure requires pH 1,4 and can not be combined with any other labelling. The alternative to the labelling of cell wall is labelling of plasma membrane that can strongly improve equalness of cell boundaries. The use of FM™ 4-64FX, as a fixable analogy of FM™ 4-64 membrane stain, showed the satisfactory segmentation quality, However, it does not allow us to combine this labelling successfully with DAPI or gene expression (immunolocalization) labeling. A more vigorous fixation procedure punctuated the membrane lipid bilayers. The successful combination of triple labelling in our hands was use of calcofluor whitefor cell boundaries, antibodies for gene expression and propidium iodide for nuclei labeling. Another possibility is to use nuclear labeling with DAPI, which allows us to detect cell position in the organs but does not allow cell geometry detection. Note: cell boundary labelling protocol is based on binding of propidium iodide to deketonized polysaccharides of the cell wall under low pH (1,4) in the presence of sulfur. Although basic protocol has been described previously (Truernit et al., 2009), significant modifications are required to adapt the protocol for 3D scanning and analysis. Namely, fixation in acetic acid led to significant tissue maceration and often damaged mature part. That's why we recommend performing fixation with formaldehyde in MTSB buffer at pH 7. The de-ketonization level (time of periodic acid treatment) is another crucial parameter. For Arabidopsis root 30 minutes, de-ketonization in 1% periodic acid partially punctuated the cell walls especially in the mature part. We recommend reducing de-ketonization time to 15-20 minutes. Mounting procedure is another crucial step. One has to use a spacer with a thickness similar to your object (100 µm for Arabidopsis root, 300 µm for tobacco root). For thick object, one can use double-side scanning by mounting samples between 2 coverslips: 24x60 as base and 24x32 as cover. This adjustment allows scanning objects from both sides to avoid low signal/noise ratio in the down part.
The alternative to the labelling of cell wall is labelling of plasma membrane that can strongly improve equalness of cell boundaries. The use of FM™ 4-64FX, as a fixable analogy of FM™ 4-64 membrane stain, showed the satisfactory segmentation quality, However, it does not allow us to combine this labelling successfully with DAPI or gene expression (immunolocalization) labeling. A more vigorous fixation procedure punctuated the membrane lipid bilayers. The successful combination of triple labelling in our hands was use of calcofluor whitefor cell boundaries, antibodies for gene expression and propidium iodide for nuclei labeling. Another possibility is to use nuclear labeling with DAPI, which allows us to detect cell position in the organs but does not allow cell geometry detection.
More information you can find in: Pasternak, T., Tietz, O., Rapp, K., Begheldo, M., Nitschke, R., Ruperti, B., & Palme, K. (2015). Protocol: an improved and universal procedure for whole-mount immunolocalization in plants. Plant Methods, 11(1), 50.
Scanning protocol
Proper image analysis requires equal signal intensity through all samples. However, it is very difficult to achieve in thick objects because of the samples' optical density.
There are several ways to improve equal signal intensity:
- Dynamically regulated scanning by gradual changes detector gain, laser power, averaging to keep signal: noise ratio at a similar level along with the sample;
- Use double-side scanning. The second way is more challenging and can be applied to the samples with thicknesses of more than 250 µm.
Note: Always adjust immersion medium and embedding medium to the average refractive index of the sample for optimum image quality especially for deep optical sectioning. A confocal laser scanning microscope with at least four lasers (2P, 488, 543/561, and 633) are required. We recommend the following objectives: x25 for cell geometry with glycerol immersion and x40 or x63 for gene expression, cell cycle, and chromatin structure analysis. Scanning should be performed with at least 1024x1024 pixels per frame at 16Bit and with amplifier offset close to zero to avoid underexposed image regions. Z-stack corrections are highly recommended to obtain reasonable signal to noise ratio (SNR) throughout the stack while avoiding over-exposure. To increase image quality in the down part, one can increase average numbers or reduce scanning speed in this region. Choice of the optimal objective depends on the type of analysis: for cell volumetric analysis x25 or x40 objective with immersion correction should be used. For gene expression analysis, cell cycle analysis and chromatin structure, minimum x40, but better x63 objective should be used.
Image processing protocol
FAQ.
- iRoCS is installed but does not start
IRoCS Toolbox is developed inside Freiburg University, hence its binaries are not signed for Windows SmartScreen. However, it is safe to run labelling.exe or other released executables, and their source code can be found on GitHub (https://github.com/lmb-freiburg/iRoCS-Toolbox). If Windows SmartScreen displays an information window when running labelling.exe, saying "Windows protected your PC", you can click "More Info", and then "Run Anyway".
- Can iRoCS run on a laptop?
Yes, any laptop can be used for image analysis, but laotop has to have enough RAM memory (minimal 8Gb for segmnentation/nuclei detection).
- The program crashes after processing 10-12%, why?
Check you memory resources thriough task-manager, close other programs; increase element size (for segmentation); or use computer with more RAM.
- I imported channel, but it is not visible after loading, why?
If your image stack is stored in 8 bits instead of 16 bits, the data will be very dark to see. You can click "Normalize" button to visualize your data.
- Can any 3D stack be analyzed in iRoCS?
Yes, however, the accuracy of segmentation depends on the image quality. You can adjust gamma correction to a value of 2 for the images with the large differences between cell border thickness.
Publications
Burkhardt, H. (2009) XuvTools: free, fast and reliable stitching of large 3D datasets. Journal of microscopy, 233(1), 42-60.
Lavrekha, V. V., Pasternak, T., Ivanov, V. B., Palme, K., & Mironova, V. V. (2017) 3D analysis of mitosis distribution highlights the longitudinal zonation and diarch symmetry in proliferation activity of the Arabidopsis thaliana root meristem. The Plant Journal, 92(5), 834-845.
Lavrekha, V. V., Pasternak, T., Palme, K., & Mironova, V. V. (2020) 3D Analysis of Mitosis Distribution Pattern in the Plant Root Tip with iRoCS Toolbox. In Plant Stem Cells (pp. 119-125). Humana, New York, NY.
Liu, K., Schmidt, T., Blein, T., Dürr, J., Palme, K., & Ronneberger, O. (2013, April) Joint 3d cell segmentation and classification in the arabidopsis root using energy minimization and shape priors. In 2013 IEEE 10th International Symposium on Biomedical Imaging (pp. 422-425). IEEE.
_Liu, K., Lienkamp, S. S., Shindo, A., Wallingford, J. B., Walz, G., & Ronneberger, O. (2014, April) Optical flow guided cell segmentation and tracking in developing tissue. In 2014 IEEE 11th International Symposium on Biomedical Imaging (ISBI) (pp. 298-301). IEEE.
Omelyanchuk, N. A., Kovrizhnykh, V. V., Oshchepkova, E. A., Pasternak, T., Palme, K., & Mironova, V. V. (2016) A detailed expression map of the PIN1 auxin transporter in Arabidopsis thaliana root. BMC plant biology, 16(1), 5.
Pasternak, T., Tietz, O., Rapp, K., Begheldo, M., Nitschke, R., Ruperti, B., & Palme, K. (2015) Protocol: an improved and universal procedure for whole-mount immunolocalization in plants. Plant Methods, 11(1), 50.
Pasternak, T., Haser, T., Falk, T., Ronneberger, O., Palme, K., & Otten, L. (2017) A 3D digital atlas of the Nicotiana tabacum root tip and its use to investigate changes in the root apical meristem induced by the Agrobacterium 6b oncogene. The Plant Journal, 92(1), 31-42.
Pasternak, T., Teale, W., Falk, T., Ruperti, B., & Palme, K. (2018) A PLA-iRoCS Pipeline for the Localization of Protein–Protein Interactions In Situ. In Phenotypic Screening (pp. 161-170). Humana Press, New York, NY.
Pasternak, T., Groot, E. P., Kazantsev, F. V., Teale, W., Omelyanchuk, N., Kovrizhnykh, V., ...& Mironova, V. V. (2019) Salicylic acid affects root meristem patterning via auxin distribution in a concentration-dependent manner. Plant physiology, 180(3), 1725-1739.
Pasternak, T. P., Ruperti, B., & Palme, K. (2020) A simple high efficiency and low cost in vitro growth system for phenotypic characterization and seed propagation of Arabidopsis thaliana. bioRxiv. https://doi.org/10.1101/2020.08.23.263491
Pasternak, T.P., Kircher, S. and Palme, K. (2021) Estimation of cell cycle kinetics in higher plant root meristem with cellular fate and positional resolution. bioRxiv, pp.2021-01.
Savina, M., Lavrekha, V., T Pasternak, Mironova V (2019) Systems biology study on the WOX5 role in the distal part of the root meristem in Arabidopsis thaliana Plant Genetics, Genomics, Bioinformatics, and Biotechnology (PlantGen2019).
Savina, M. S., Pasternak, T., Omelyanchuk, N. A., Novikova, D. D., Palme, K., Mironova, V. V., & Lavrekha, V. V. (2020) Cell dynamics in WOX5-overexpressing root tips: the impact of local auxin biosynthesis. Frontiers in plant science, 11.
Schmidt, T., Pasternak, T., Liu, K., Blein, T., Aubry‐Hivet, D., Dovzhenko, A., ... & Ronneberger, O. (2014) The iRoCS T oolbox–3 D analysis of the plant root apical meristem at cellular resolution. The Plant Journal, 77(5), 806-814.
Schulz, J., Schmidt, T., Ronneberger, O., Burkhardt, H., Pasternak, T., Dovzhenko, A., & Palme, K. (2006) Fast scalar and vectorial grayscale based invariant features for 3d cell nuclei localization and classification. In Joint Pattern Recognition Symposium (pp. 182-191). Springer, Berlin, Heidelberg.
Teale, W. D., Pasternak, T., Dal Bosco, C., Dovzhenko, A., Kratzat, K., Bildl, W., ... & Shahriari, M. (2020) Flavonol‐mediated stabilization of PIN efflux complexes regulates polar auxin transport. The EMBO Journal, e104416.
Tessi, T., Shahriari, M., Maurino, V., Meissner, E., Novak, O., Pasternak, T., ... & Teale, W. (2020). The auxin transporter PIN1 and the cytokinin transporter AZG1 interact to regulate the root stress response.
Software
HRPPP runs on both Linux and Windows. However, Linux version requires less memory and computing power, therefore more beneficial. HRPPP does not requires any extra software package and can be installed on any computer, including laptop. Minimal memory requirements for an analysis of a relatively small object is 8 Gb DDR, which made it compatible even with a non-professional laptop. More details about installation one can find in tutorial and on web-site (https://lmb.informatik.uni-freiburg.de/lmbsoft/iRoCS/)